Remote Monitoring with Glances
 Inspried by a feature requests I started looking into the available options to do monitoring of remote hosts. The feature request is about displaying system information in a similar way than the systemmonitor sensor does it for the local system. After a while I started to think that it would be a nice addition for a small home network where no full-blown system monitoring setup is present.
The basic problem is to get the data from the remote host. Starting with psutil that is used by the systemmonitor sensor, a possible solution is only a click away and named Glances. Glances has a nice curses-based interface and a RESTful API.
The Glances sensor sensor uses that API to get all needed data.
In this post a default Fedora 22 Workstation installation is used on the host that should be monitored. In fact, it doesn’t matter if the system is the local one or a remote one as long as Glances is available. With some adjustments it should work on your own systems too. The difference will be the package and the firewall management tools.
First some extra packages are needed beside Glances, especially the bottle webserver. I guess that Glances is available for your distribution as well. Otherwise follow those instructions.
$ sudo dnf -y install glances python-bottle
On Fedora the Firewall settings are strict. Let’s open port 61208 to allow other hosts to connect to that port. This is not needed if you just want to observe your local machine.
$ sudo firewall-cmd --permanent --add-port=61208/tcp
$ sudo firewall-cmd --reload
Launch glances and keep an eye on the output.
$ glances -w
Glances web server started on http://0.0.0.0:61208/
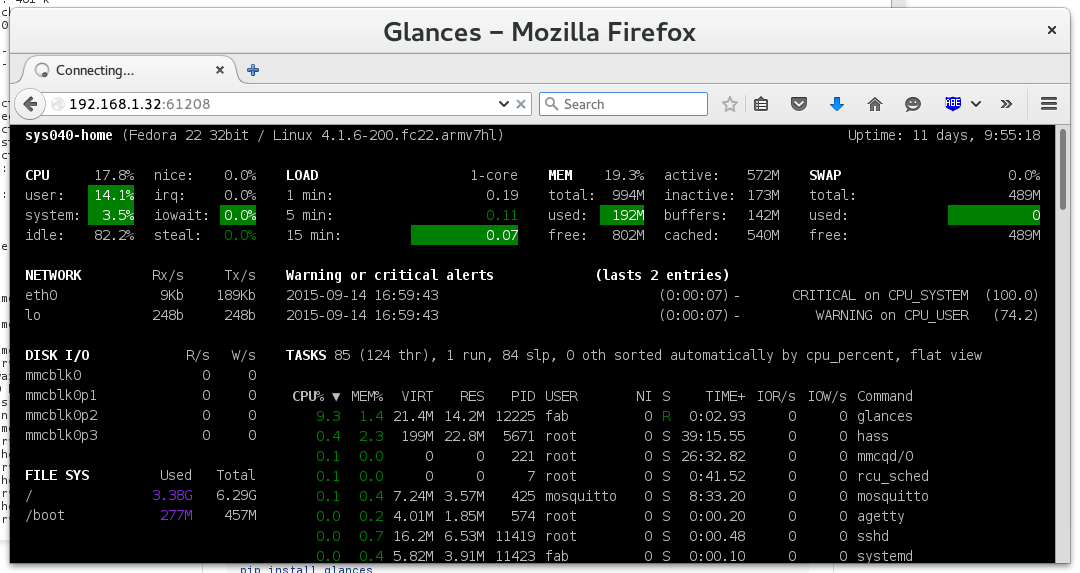
Now browse to http://IP_ADRRESS:61208/. You should see the webified view of Glances.
 Glances web interface
Another check is to access the API located at http://IP_ADRRESS:61208/api/2/mem/used and to confirm that a detail about your memory usage is provided as a JSON response. If so, you are good to proceed.
$ curl -X GET http://IP_ADDRESS:61208/api/2/mem/used
{"used": 203943936}
Add the glances sensor entry to your configuration.yaml file and restart Home Assistant then.
# Example configuration.yaml entry
  - platform: glances
    name: NAS
    host: IP_ADDRESS
    resources:
      - 'disk_use_percent'
      - 'disk_use'
      - 'disk_free'
If there are no error in the log file then you should see your new sensors.
 The Glances sensors
Glances has a couple of optional dependencies which are extenting the range of provided information. This means that it would be possible to get details about the RAID system, HDD temperature, IP addresses, sensors, etc., please create a Pull request with your additions or a Feature request if you want see more details in your Home Assistant frontend.